November 3, 2025
16 min read
Agent Telemetry: Building Traces, Metrics & CI/CD for Claude Agents
Author:
Pavel Borobov, Staff Solutions Architect at Provectus
Introduction
The adoption of AI agents marks a dramatic shift in enterprise automation operations. Large language models (LLMs) have undergone rapid evolution, leading to the deployment of autonomous agents in high-stakes industries. From automated trading software managing billions to AI-driven healthcare systems, businesses are embedding LLM-powered agents deep within their workflows. According to LangChain’s State of AI Agents Report (2024), 51% of companies now use agents in production, with 78% planning to integrate them into operational ecosystems within the next two years.
However, this shift introduces unprecedented challenges. Unlike traditional enterprise automation methods, which follow predictable input-output mappings, AI agents employ non-deterministic reasoning chains that adapt dynamically based on context, history, and memory. A single interaction can trigger dozens of invisible processes – prompt rewrites, retrievals, and tool selections – creating what practitioners now call semantic observability gaps.
The impact of this phenomenon is tangible. Gartner projects that over 40% of agentic AI initiatives will be canceled by 2027, not because of model capabilities but because organizations fail to demonstrate ROI, maintain control, or comply with regulations. Without visibility into agent behavior, enterprises cannot debug failures, optimize cost-performance tradeoffs, or achieve business goals.
To successfully deploy AI agents at scale, you need to bridge this gap with agent telemetry – the systematic capture of traces, metrics, logs, and evaluation signals during execution. This observability framework transforms AI agents into auditable, optimizable systems. While OpenAI agents are more common in enterprise environments, Claude offers unique advantages for telemetry-centric deployments. Its large context window preserves long-term state, its structured reasoning improves trace coherence, and its Constitutional AI principles yield more predictable, auditable behavior.
This article presents a production-grade guideline for scaling Claude agents responsibly. Using modern observability frameworks, such as OpenTelemetry, Langfuse, and Traceloop, we will demonstrate how to move beyond experimentation and implement an infrastructure where every decision is traceable, every cost is measurable, and every outcome is auditable.
The Fundamentals of Agent Telemetry
Agent telemetry is the systematic collection and analysis of execution data from AI systems where LLMs determine the control flow. Unlike traditional software, AI agents exhibit non-deterministic behavior through complex reasoning chains, tool selections, and context-aware decisions.
Telemetry provides the necessary visibility to debug, optimize, and audit these autonomous, multi-step workflows, transforming them from black boxes into observable systems. It is worth noting a critical but subtle distinction: telemetry refers to the mechanism for collecting data. On the other hand, observability is the system property that enables you to ask and answer questions about your agent’s behavior.
With that foundation in place, let’s break down the core components of agent telemetry. A robust telemetry implementation captures four complementary data streams:
- Traces: Provide a Directed Acyclic Graph (DAG) of an agent’s execution path. Each span within a trace represents a discrete operation – a Claude API call, a tool execution, or a memory retrieval – enabling engineers to visualize the entire reasoning chain from user input to final response.
- Metrics: Quantify system behavior with measurements like latency percentiles (p50, p95, p99), token consumption per model (e.g., Claude Sonnet vs. Haiku), cost per task, and error rates. These are essential for capacity planning and cost optimization.
- Logs: Offer immutable, timestamped records of discrete events, including state changes or specific agent actions, crucial for forensic analysis and security auditing.
- Evaluations: Generate quality scores through automated checks (e.g., LLM-as-a-judge), rule-based validators, or user feedback. These signals measure the business effectiveness of an agent’s output, not just its technical correctness.
Why Telemetry Is a Production Necessity
For Claude agents in production, telemetry addresses three fundamental engineering challenges:
- Debugging Complex Failures: A distributed trace instantly pinpoints the root cause of a failure – whether it was a poorly formulated prompt to Claude, a tooling exception, or a flawed data retrieval – reducing Mean Time to Resolution (MTTR) from hours to minutes.
- Controlling Cost and Performance: Claude’s pricing model makes token usage a primary driver of cost and performance. Metrics on input/output tokens per operation enable teams to identify and optimize inefficient tool calls or verbose prompts, which directly impact the infrastructure budget.
- Ensuring Auditability and Compliance: In regulated environments, it is important to document an agent’s decision-making process. Telemetry captures the complete provenance of each action, creating an immutable audit trail that satisfies requirements for data lineage and transparency of reasoning.
The Claude Telemetry Stack: From Foundation to Specialization
The modern stack is layered, allowing teams to choose the right level of abstraction and practical integration.
- OpenTelemetry (OTel) is the foundational, CNCF-standard protocol for generating, collecting, and exporting telemetry data. Its LLM extensions (OpenLLMetry) provide auto-instrumentation for the Anthropic SDK and popular agent frameworks, ensuring vendor-neutral data collection that can be routed to any backend.
- Langfuse is an open-source LLM observability platform that consumes OTel data. It provides a specialized UI for tracing complex agent workflows, managing prompt versions, and analyzing costs and latencies across different Claude model deployments.
- Traceloop adds an automated evaluation layer on top of OTel traces. It runs continuous quality checks (e.g., for correctness, data leakage, or policy adherence) on live agent traffic, enabling proactive detection of issues specific to your Claude agent’s domain.
What Challenges Do Businesses Face When Adopting Telemetry For Claude Agents?
Deploying Claude agents with practical telemetry introduces challenges that reach far beyond conventional software monitoring. While Claude’s privacy-first ecosystem makes it uniquely capable of managing complex reasoning workflows, these same capabilities amplify observability and integration complexity.
Tracking, debugging, and securing non-deterministic reasoning chains at enterprise scale demands new forms of visibility and infrastructure discipline.
#1 Cost Spiral from Unoptimized Operations
Claude’s high-capacity context enables sophisticated agent behavior, but also exposes enterprises to runaway costs risks if left unmonitored. Poorly optimized prompts, recursive tool calls, and redundant retrievals can increase token consumption.
Galileo AI’s 2025 analysis reveals how hidden costs derail agentic AI projects. In RAG pipelines, noisy embeddings reduce retrieval accuracy by 20-30%, triggering exponential retry costs. Similarly, poor data quality increases inference costs by 15-25% through unnecessary context window expansion. These inefficiencies compound at scale, turning minor prompt inflation into systematic cost drivers.
Unmonitored, these inefficiencies not only inflate operational expenses but also mask systemic design flaws, such as wasted tokens, redundant reasoning, and unbounded recursion. Telemetry at the token and span level is now essential for diagnosing these cost cascades and maintaining predictable economics in Claude-based systems.
#2 Enterprise Integration Complexity
Production Claude agents rarely exist in isolation. They mediate complex workflows involving databases, APIs, CRMs, document stores, and microservices, often spanning multiple clouds and data sources. Each integration layer introduces a potential point of failure.
According to the AI Multiple (2024) and Galileo AI (2025) research, 80% of enterprises cite data integration as their top barrier to AI adoption, while 85% of failed AI projects can be traced back to data quality or system interoperability issues. Claude’s reasoning-centric design can exacerbate these challenges: a malformed API response or inconsistent schema can lead to a chain of flawed decisions that appear valid on the surface.
Traditional logs capture only event outcomes, not reasoning context. A Claude agent might log a “successful” HTTP response while silently reasoning over corrupted or incomplete data. Without distributed tracing across all system touchpoints, teams cannot isolate whether a failure originated in agent reasoning, retrieval logic, or an external service. The result is operational opacity – agents that appear healthy while silently misfiring in production.
#3 Compliance and Audit Trail Requirements
As Claude agents move into regulated domains such as finance, healthcare, and government, the need for explainability and decision provenance becomes non-negotiable. Frameworks such as GDPR Article 22 (automated decision-making), HIPAA §164.312 (audit controls), and SOX Section 404 (internal controls) require that organizations document why a computerized system made a particular decision, including the intermediate reasoning steps, retrieval influences, and safety guardrail activations.
Conventional application logs are inadequate. They record what happened, but not why it happened. A compliant audit trail for Claude agents must capture the full reasoning context, including prompts, model versions, tool calls, and evaluation results without compromising privacy or security.
The stakes are high. IBM’s 2024 Cost of a Data Breach Report places the average impact of an LLM-related incident above $4 million, with most breaches traced to improperly secured logs or telemetry pipelines that captured raw PII. Observability data itself becomes a potential attack vector if not encrypted, redacted, and access-controlled. Enterprises face the dual challenge of ensuring both reasoning transparency and data minimization, balancing audit readiness against exposure risk.
Building Enterprise-Grade Telemetry for Claude Agents
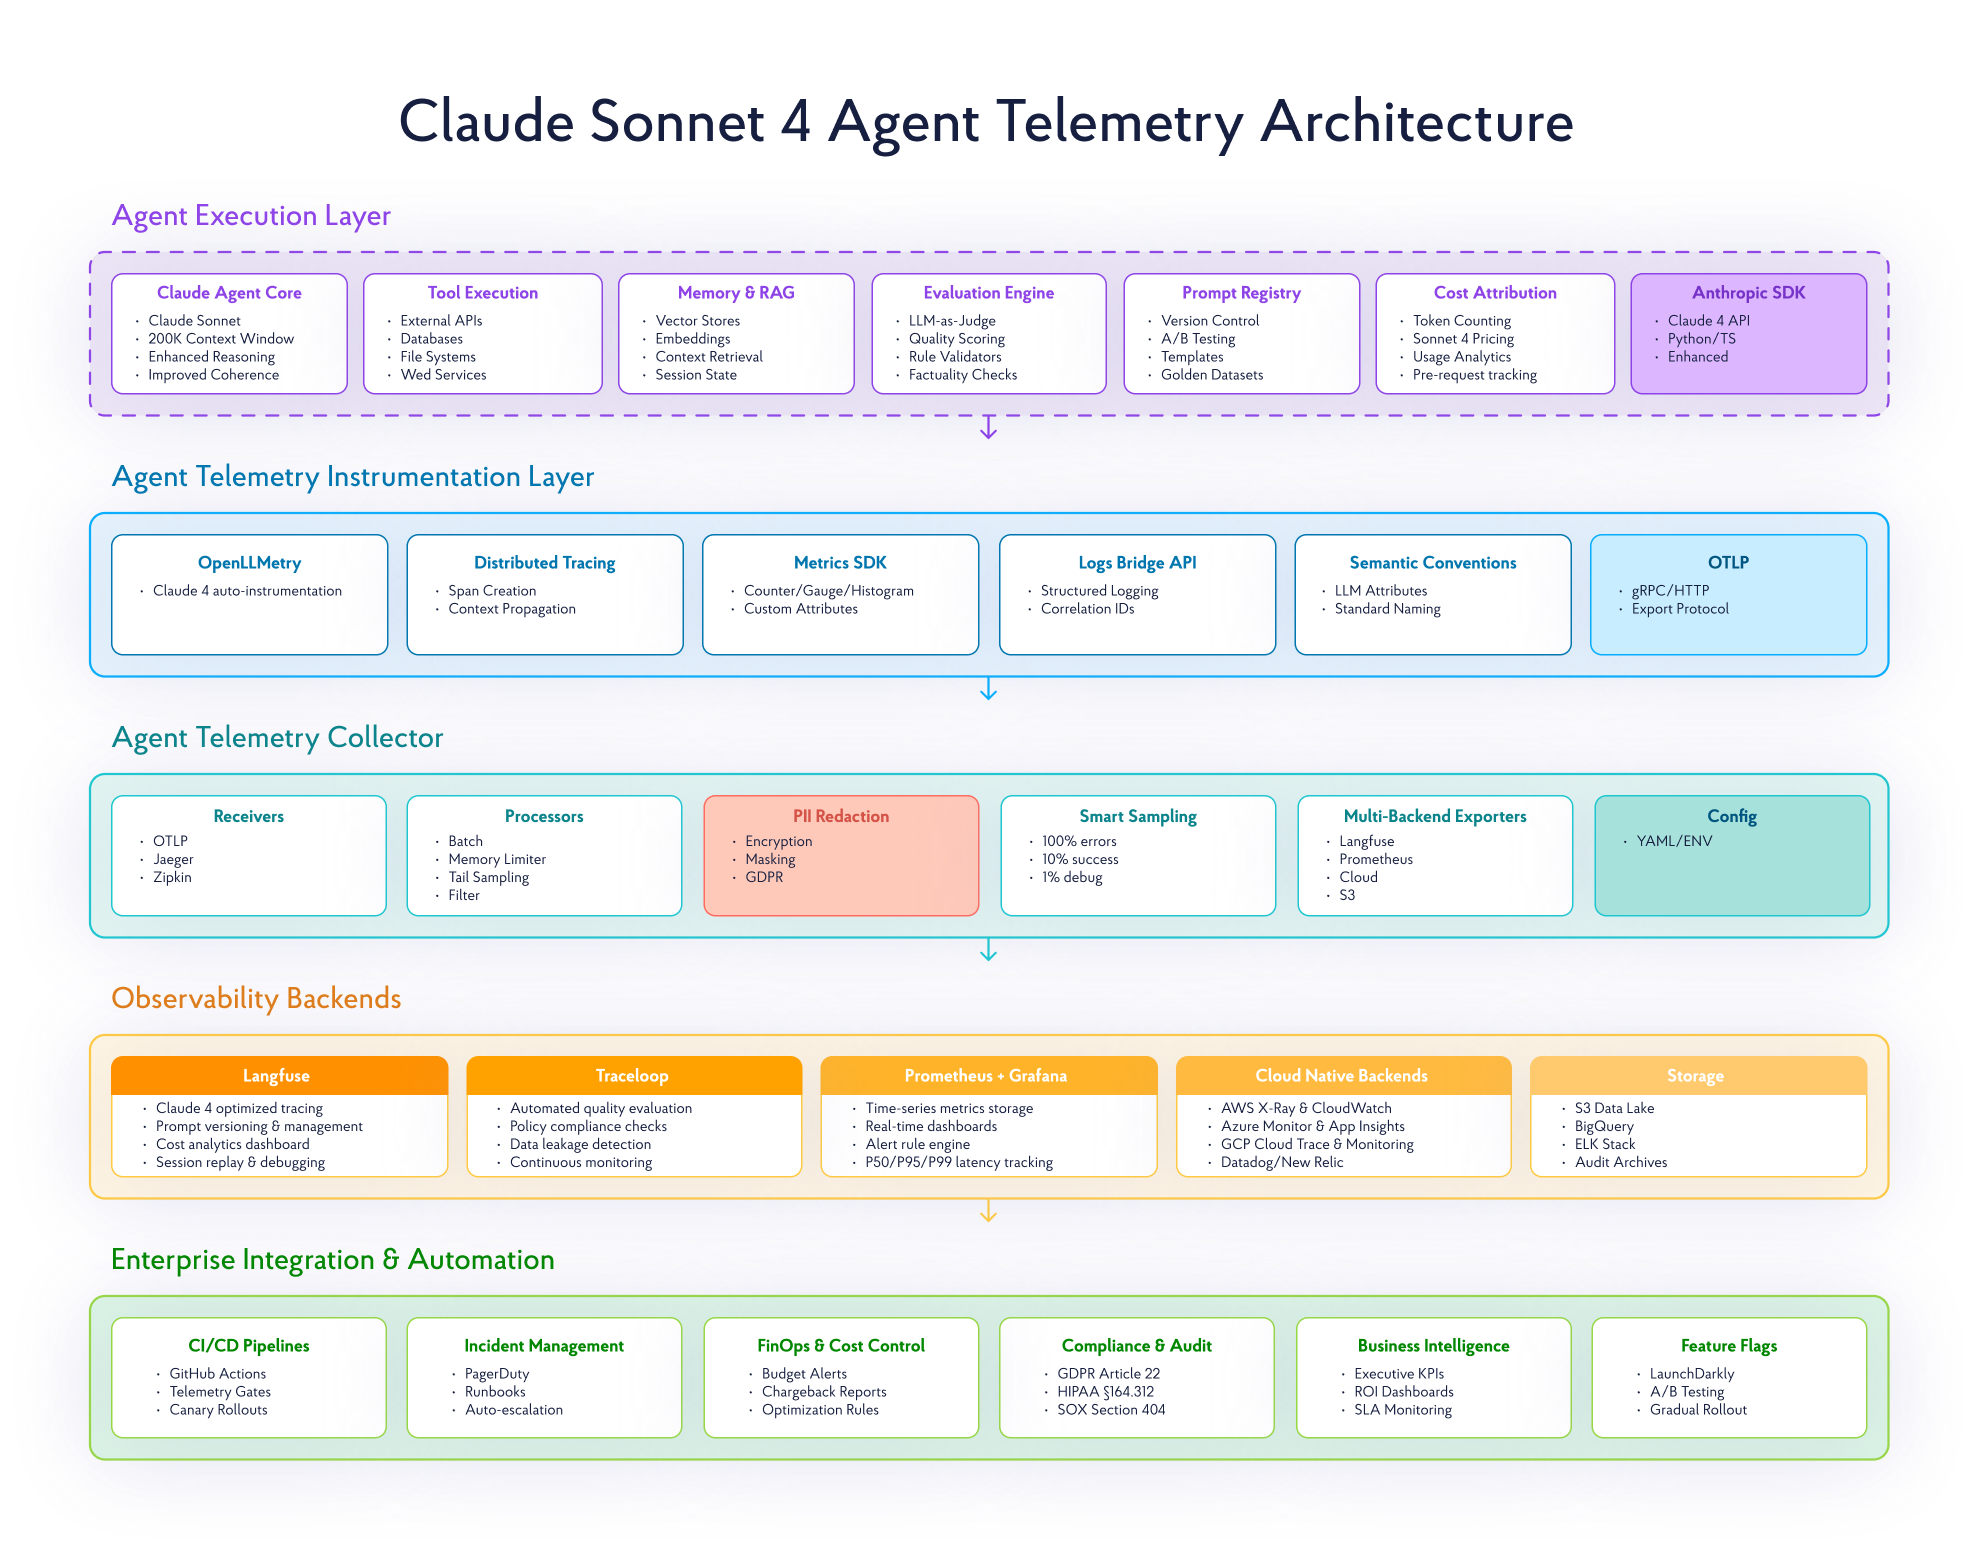
This section outlines a production-proven architecture for instrumenting Claude agents with enterprise-grade observability.
The telemetry framework we present integrates the following foundational principles:
- Distributed tracing which captures and visualizes Claude’s reasoning process end-to-end
- Strategic metrics that quantify performance, efficiency, and cost at scale
- Compliance logging that embeds transparency and auditability into every agent decision
By the end, you will have a practical engineering guide for deploying Claude agents with comprehensive enterprise observability practices.
#1 Production-Ready Trace Architecture
Traditional monitoring tools show what happened. Distributed tracing reveals why. Each Claude session generates a complex reasoning graph comprising prompt generation, context retrieval, tool selection, and evaluation that conventional logs cannot capture.
OpenTelemetry addresses this by wrapping Claude SDK calls with semantic spans that describe each reasoning operation.
Each span includes attributes such as user intent, token usage, and evaluation scores, creating a distributed decision graph when fed into aggregation platforms like Langfuse or Jaeger.
pythonfrom anthropic import Anthropic
from opentelemetry import trace
import time
tracer = trace.get_tracer("claude-agent")
client = Anthropic(api_key="YOUR_API_KEY") # For Claude Opus 4.1, use model='claude-opus-4-1-20250805'
def calculate_cost(usage):
"""Calculate approximate cost based on Claude pricing"""
# Note: Check current Claude pricing at https://www.anthropic.com/api
# Example calculation based on typical Claude model pricing
input_cost = (usage.input_tokens / 1_000_000) * 3.0
output_cost = (usage.output_tokens / 1_000_000) * 15.0
return round(input_cost + output_cost, 4)
def process_business_request(user_query: str, user_context: dict):
with tracer.start_as_current_span("business_workflow") as span:
span.set_attributes({
"user.id": user_context.get("user_id"),
"task.type": user_context.get("task_type"),
"department": user_context.get("department")
})
start_time = time.time()
response = client.messages.create(
model="claude-3-5-sonnet-20241022",
max_tokens=1024,
messages=[{"role": "user", "content": user_query}]
)
latency_ms = (time.time() - start_time) * 1000
# Capture Claude-specific telemetry
span.set_attributes({
"tokens.input": response.usage.input_tokens,
"tokens.output": response.usage.output_tokens,
"cost.estimated_usd": calculate_cost(response.usage),
"model.latency_ms": latency_ms,
"model.id": response.model
})
return response.content[0].text
When visualized in Langfuse, these traces form a reasoning map, showing how Claude reached decisions, what they cost, and where optimizations can be applied. This operational visibility transforms debugging from a guesswork-based process into a data-driven analysis.
#2 Strategic Metrics Design
Traces expose how Claude operates. Metrics quantify how well it performs. Without clear performance metrics, teams lack visibility into efficiency, degradation, and cost control.
Claude telemetry requires a different measurement philosophy than traditional APM systems. Instead of CPU or memory, cost and quality are the primary performance dimensions. Key categories include:
- Token Efficiency: Input/output token ratios, average cost per reasoning chain
- Performance: P50-P99 latency across model inference and external tool calls
- Quality: Factuality, coherence, and safety evaluation scores
- Business Impact: Cost per task, success rate by prompt version, and compliance pass rate
Platforms like Langfuse aggregate model-level data such as token consumption, evaluation scores, and prompt versions, while Prometheus handles infrastructure-level metrics. Together, they provide a unified operational view, linking Claude’s cognitive performance to measurable business KPIs.
Example:
- token_efficiency: cost-per-token per prompt version
- sla_latency_p95: 95th percentile response time
- compliance_pass_rate: % of evaluations meeting governance thresholds
These signals feed dashboards (Grafana, CloudWatch, or Langfuse UI) that translate telemetry into business insights, revealing where reasoning inefficiencies, latency bottlenecks, or rising token costs originate.
#3 Compliance-First Logging
In heavily regulated industries like healthcare and finance, observability is a mandatory requirement. GDPR Article 22, HIPAA §164.312, and SOX Section 404 mandate that AI decisions be traceable and reproducible.
Compliance logging captures decision provenance – the complete reasoning chain from user input to final output. Every structured log records prompt context, retrieval sources, safety checks, and validation outcomes.
To ensure that telemetry does not introduce new risks, logs must operate through secure-by-design principles, including encryption at rest and in transit as standardized by NIST SP 800-175B, automated PII redaction, and role-based access controls. When properly managed, logs satisfy compliance requirements while providing forensic reconstruction of Claude’s full decision rationale.
#4 Enterprise Integration Stack
Observability data achieves maximum value when deployed across the enterprise stack. Claude telemetry should operate through the same pipelines, monitoring databases, services, and cloud workloads, preventing lock-in.
OpenTelemetry Collectors serve as neutral routers, receiving telemetry from Claude agents and routing to multiple backends simultaneously. This vendor-agnostic approach ensures interoperability across AWS X-Ray, Azure Monitor, and Google Cloud Trace.
Multi-Cloud Integration Configuration:
yaml# OpenTelemetry Collector Configuration
receivers:
otlp:
protocols:
grpc:
endpoint: 0.0.0.0:4317

processors:
batch:
timeout: 10s
memory_limiter:
limit_mib: 512

exporters:
langfuse:
endpoint: "https://cloud.langfuse.com"
headers:
authorization: "Bearer ${LANGFUSE_API_KEY}"
prometheusremotewrite:
endpoint: "${PROMETHEUS_ENDPOINT}"
awsxray:
region: "us-east-1"

service:
pipelines:
traces:
receivers: [otlp]
processors: [batch, memory_limiter]
exporters: [langfuse, awsxray]
metrics:
receivers: [otlp]
processors: [batch]
exporters: [prometheusremotewrite]
This configuration enables a single Claude instance to export telemetry to specialized backends – Langfuse for LLM tracing, Prometheus for metrics, and AWS X-Ray for distributed system observability – without requiring any changes to the application code.
Cloud-native integrations automatically propagate trace context across containers (Kubernetes + Istio), connect Claude reasoning to downstream services (AWS X-Ray + Lambda), and correlate agent behavior with infrastructure health (Azure Monitor).
CI/CD for Claude Agents: Telemetry-Driven Deployment
Once telemetry visibility is established, the next step is to automate it, embedding it directly into deployment workflows.
Traditional CI/CD pipelines validate deterministic code with static tests. Claude requires a telemetry-aware CI/CD process, where performance, quality, and cost thresholds define release readiness.

#1 Automated Prompt Regression Testing
Prompts are code.
Every modification to a Claude prompt or retrieval pipeline alters the agent’s reasoning logic and must be validated before production.
In deterministic software, testing checks for binary outcomes (pass/fail). In Claude’s non-deterministic reasoning, two correct outputs can differ semantically. Therefore, “failure” must be defined through telemetry-driven thresholds, not literal matches.
Organizations maintain golden datasets – curated input/output examples with baseline scores for factuality, relevance, and safety. When a new prompt version is committed, CI pipelines automatically evaluate it against these baselines, comparing telemetry signals such as:
- Quality metrics: factuality, coherence, compliance adherence
- Operational metrics: token consumption, latency, and cost per request
Build gates, then enforce thresholds automatically:
- Reject if quality drops by more than 5% below baseline
- Block if costs exceed +20% or latency increases beyond SLA
baseline = eval_prompt("contract_review_v1")
candidate = eval_prompt("contract_review_v2")
assert candidate["quality"] >= baseline["quality"] * 0.95
assert candidate["cost"] <= baseline["cost"] * 1.20
This telemetry-based regression testing ensures that Claude evolves safely – each change measurable, auditable, and reversible before live deployment.
#2 Telemetry-Gated Deployments
CI/CD pipelines query telemetry APIs and enforce quality gates before proceeding to production.
Gate Types:
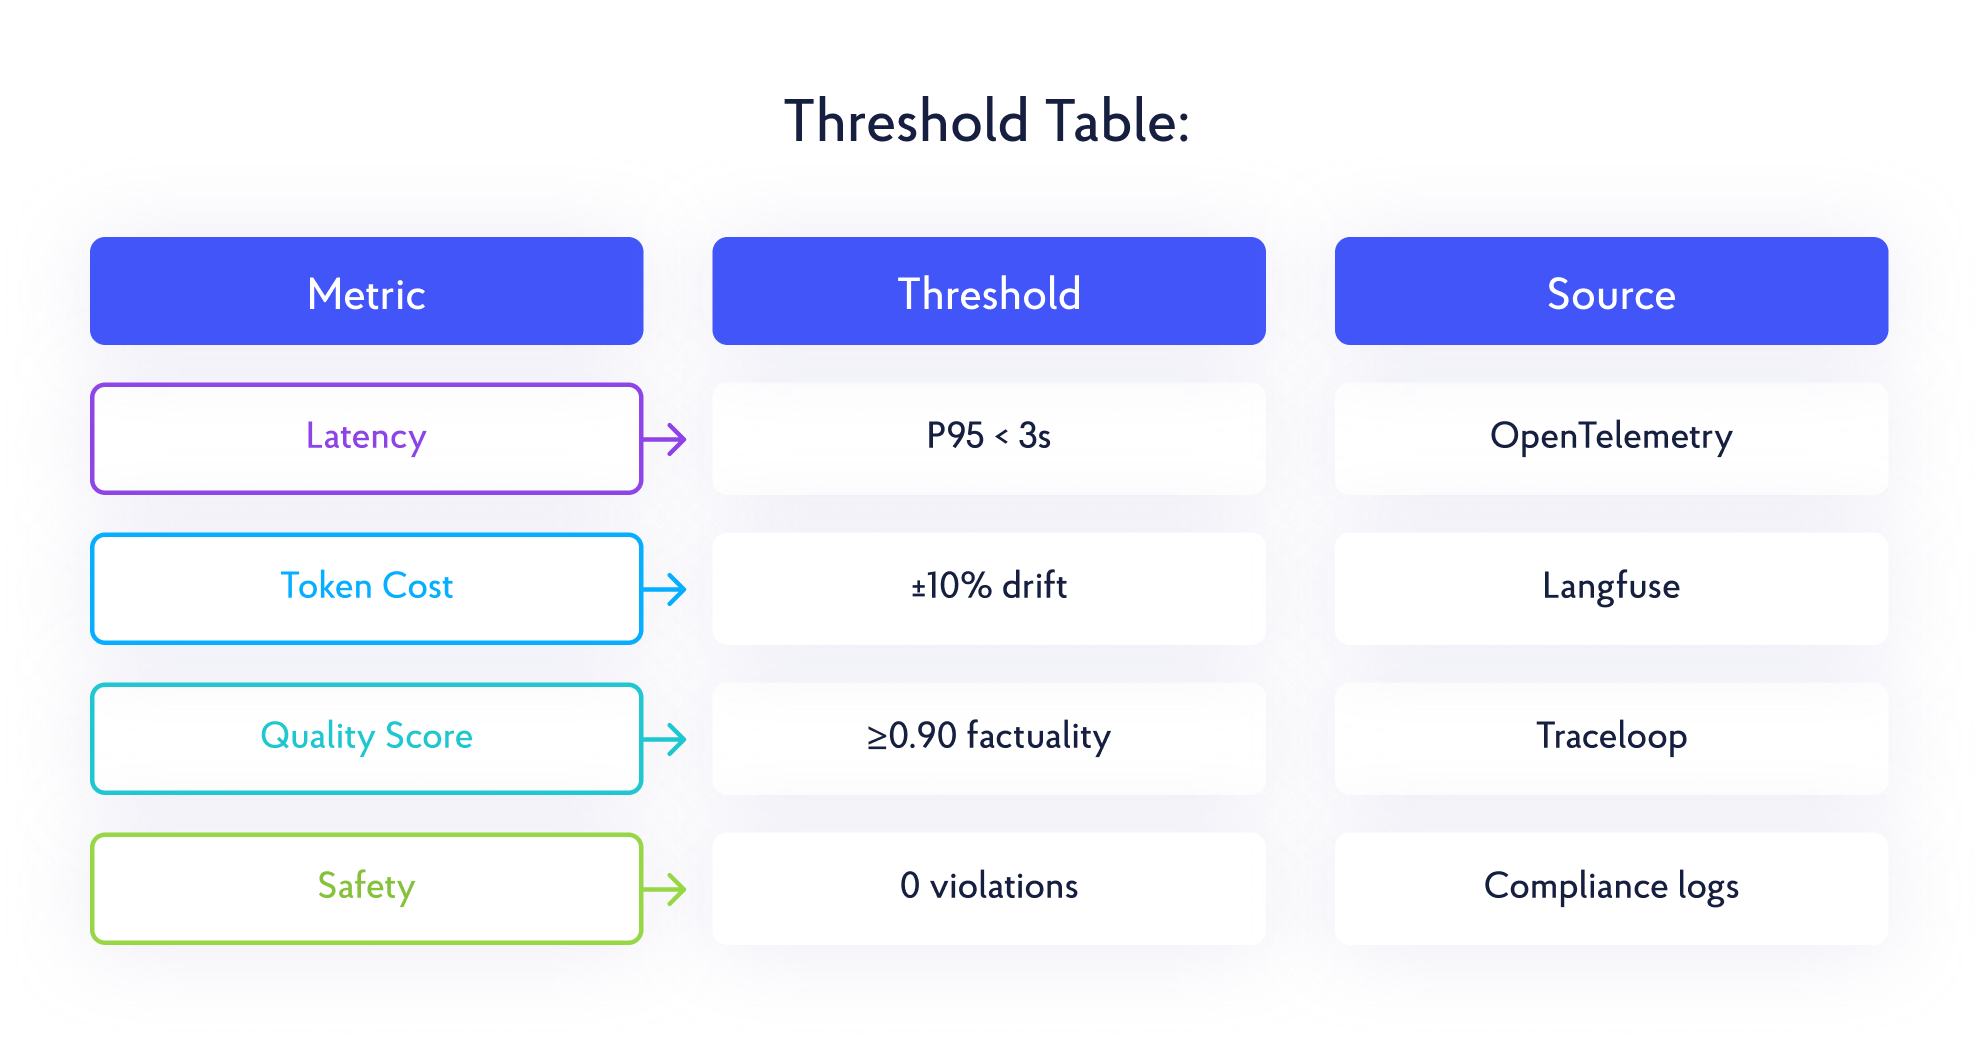
- Cost: Token consumption increase >20% fails build
- Quality: Evaluation scores <0.85 block deployment
- Compliance: PII detection halts release
- Performance: P95 latency >5s triggers rollback
GitHub Actions Implementation:
name: Claude Deployment Gate
on: [pull_request]
jobs:
telemetry-check:
runs-on: ubuntu-latest
steps:
- name: Run regression tests
run: pytest tests/test_prompt_regression.py

- name: Query baseline metrics
run: |
BASELINE=$(curl -H "Authorization: Bearer $LANGFUSE_KEY" \
https://cloud.langfuse.com/api/public/metrics?prompt=v1)
echo "baseline=$BASELINE" >> $GITHUB_OUTPUT

- name: Enforce cost threshold
run: |
# Using bc for floating point comparison
if (( $(echo "$CANDIDATE_COST > $BASELINE_COST * 1.2" | bc) )); then
echo "Cost gate failed: exceeds 20% threshold"
exit 1
fi
#3 Canary Deployments with Telemetry Validation
Deploy new configurations to 5% traffic. Monitor telemetry. Promote only if metrics prove safety.
Process:
- Route 5% traffic to Canary, 95% to baseline
- Monitor for 1-4 hours: eval scores, token costs, error rates
- Compare against baseline with real-time dashboards
- Expand (5% → 25% → 100%) if metrics pass, revert if they fail

Kubernetes with Istio enables traffic splitting. AWS Lambda aliases provide weighted distribution. LaunchDarkly offers percentage-based rollouts with real-time control.
#4 Continuous Monitoring and Feedback Loops
Post-deployment, telemetry feeds real-time pipelines:
- Real-time dashboards (Grafana/CloudWatch): Token burn rate, P95 latency, eval score trends, cost per user
- Alerting strategy (Prometheus alerting best practices):
- Critical (page on-call): Cost spike >50% in 15min, service failures
- Warning (Slack): Quality drop >10% in 1hr, SLA breaches
- Info: New deployments, traffic changes
- Nightly evaluations: Compare recent sessions against benchmarks for accuracy, latency, and compliance
- Drift detection: Flag degradation in token usage or semantic alignment
Integration with PagerDuty, Slack, or OpsGenie ensures incidents reach the right teams immediately.
#5 Cloud-Native Integration Pattern
Telemetry CI/CD integrates with cloud infrastructure through the following channels:
- AWS: Lambda for evaluation jobs, Step Functions for orchestration, X-Ray for tracing, CloudWatch for alerts
- Kubernetes: Argo Rollouts for canary management, Istio for traffic splitting, Prometheus for metrics
- Storage: DynamoDB/S3 for baselines and audit logs
- Observability: Unified view combining Claude reasoning, telemetry, with infrastructure health
Architecture Flow:
Code/Prompt Change → Automated Evaluation → Telemetry Comparison →
Deployment Gate → Canary Release → Continuous Monitoring →
Rollback/Promote Decision
Enterprise Best Practices: From Deployment to Production Maturity
Building telemetry infrastructure is one challenge. Operating it at an enterprise scale determines whether it is profitable. This section examines hard-won lessons from production Claude deployments that manage to capitalize on the discussed telemetry principles to achieve enterprise-grade observability.
#1 Instrumentation Strategy: Balancing Coverage and Cost
The most common failure pattern is over-instrumentation. Capturing full 200K-token contexts for 10,000 daily requests can generate up to 60 GB of telemetry per day. At standard cloud storage rates, that is more than $50,000 per year in storage alone – before factoring in query costs, retention policies, or compliance archiving.
The solution is smarter telemetry. Implement hierarchical sampling strategies:
- 100% sampling for errors and compliance-triggered events
- 10% sampling for successful requests to analyze performance trends
- 1% sampling with complete context preservation for deep debugging
This ensures statistical validity without overwhelming storage budgets. Platforms such as AWS X-Ray and Google Cloud Trace support dynamic sampling, automatically adjusting rates based on traffic volume and error frequency.
Quick Tip: Over-instrumentation is more expensive than under-instrumentation. Start small, expand deliberately, and optimize based on production telemetry, not assumptions.
#2 Operational Maturity: Building for Incident Response
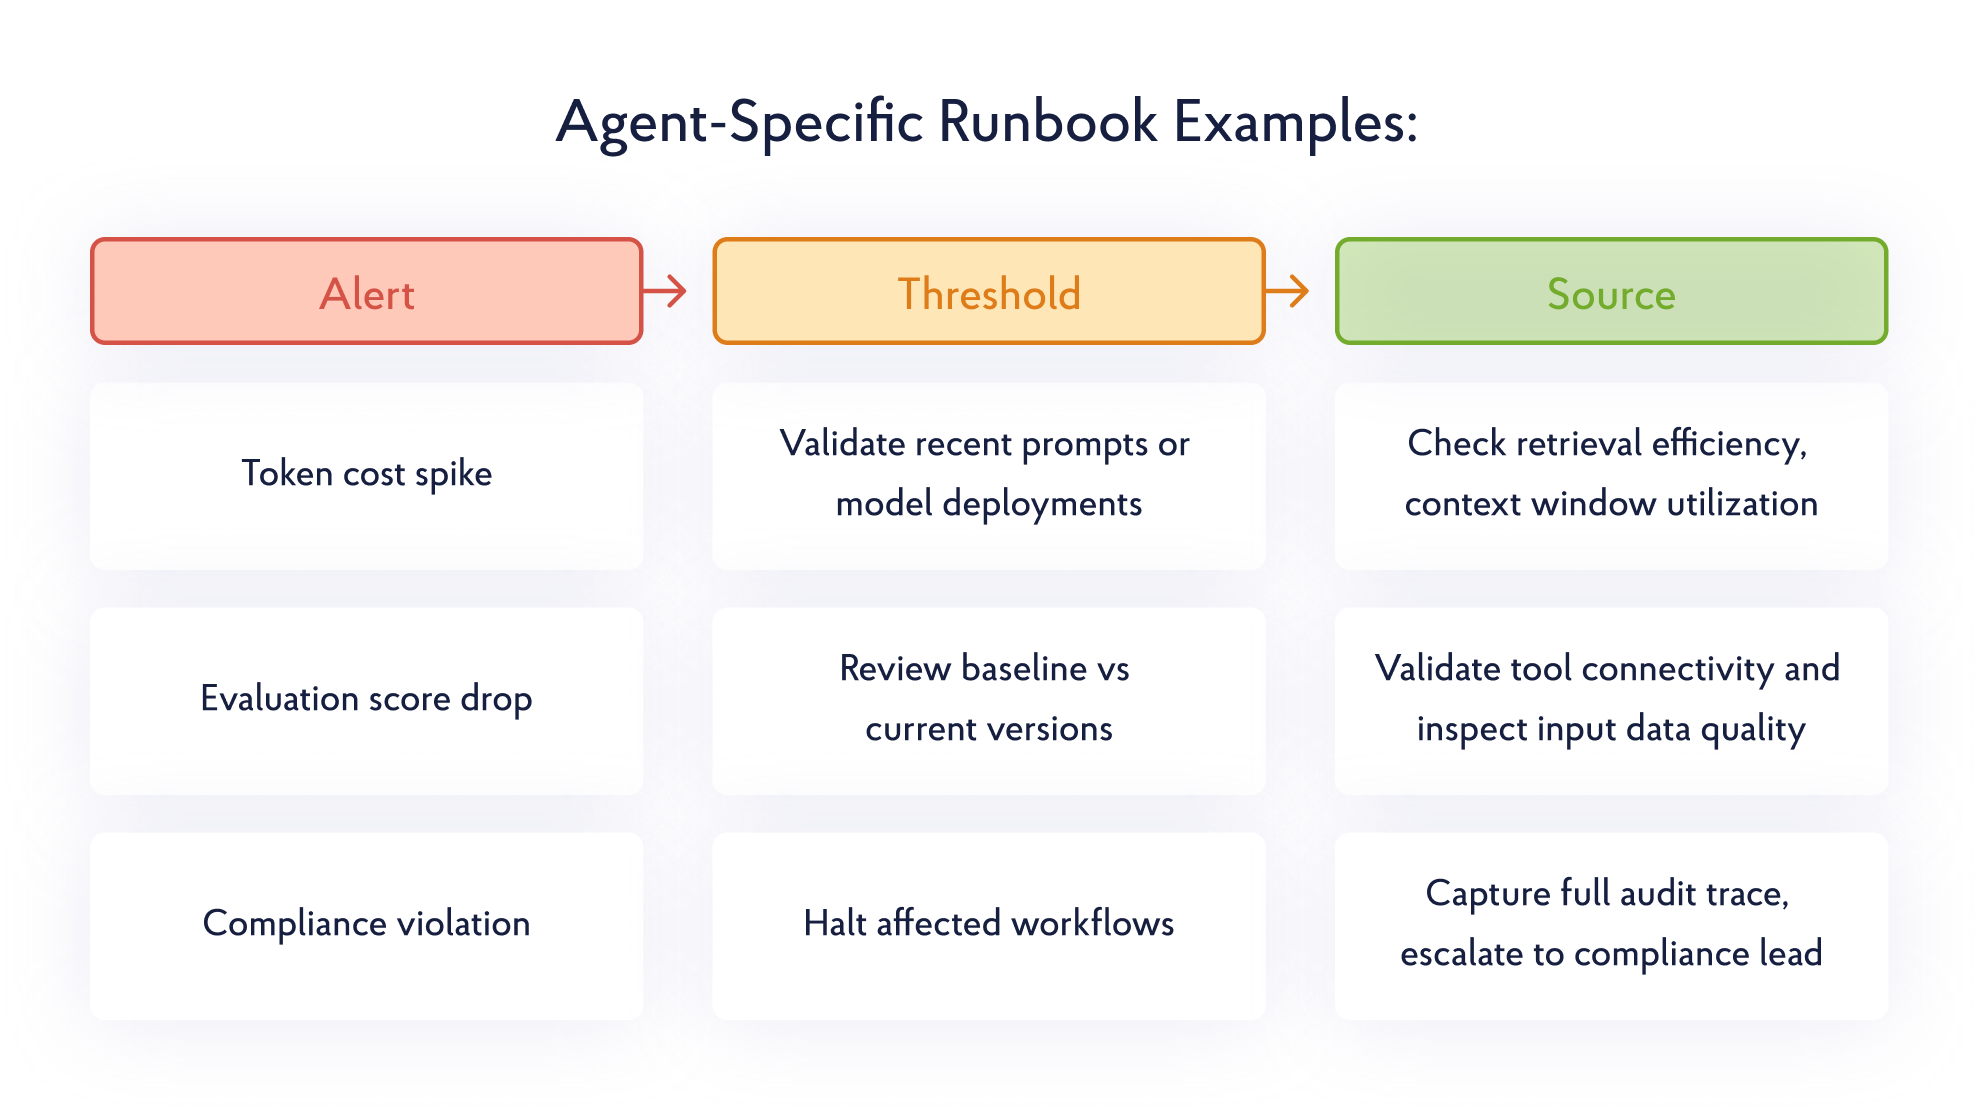
Dashboards reveal what happened. Runbooks define what to do next. Many organizations deploy telemetry but fail to operationalize it. When token costs spike at 2 A.M. or evaluation scores drop unexpectedly, response stalls because ownership is unclear.
Establish explicit ownership boundaries:
- Platform Engineering owns infrastructure health and telemetry availability
- AI Engineering owns Claude’s reasoning behavior and prompt logic
- FinOps/CostOps owns token usage and cost anomalies

Define tiered escalation paths where L1 handles service restarts, L2 manages rollbacks, and L3 addresses systemic issues. Incident platforms like PagerDuty integrate directly with OpenTelemetry alerts.
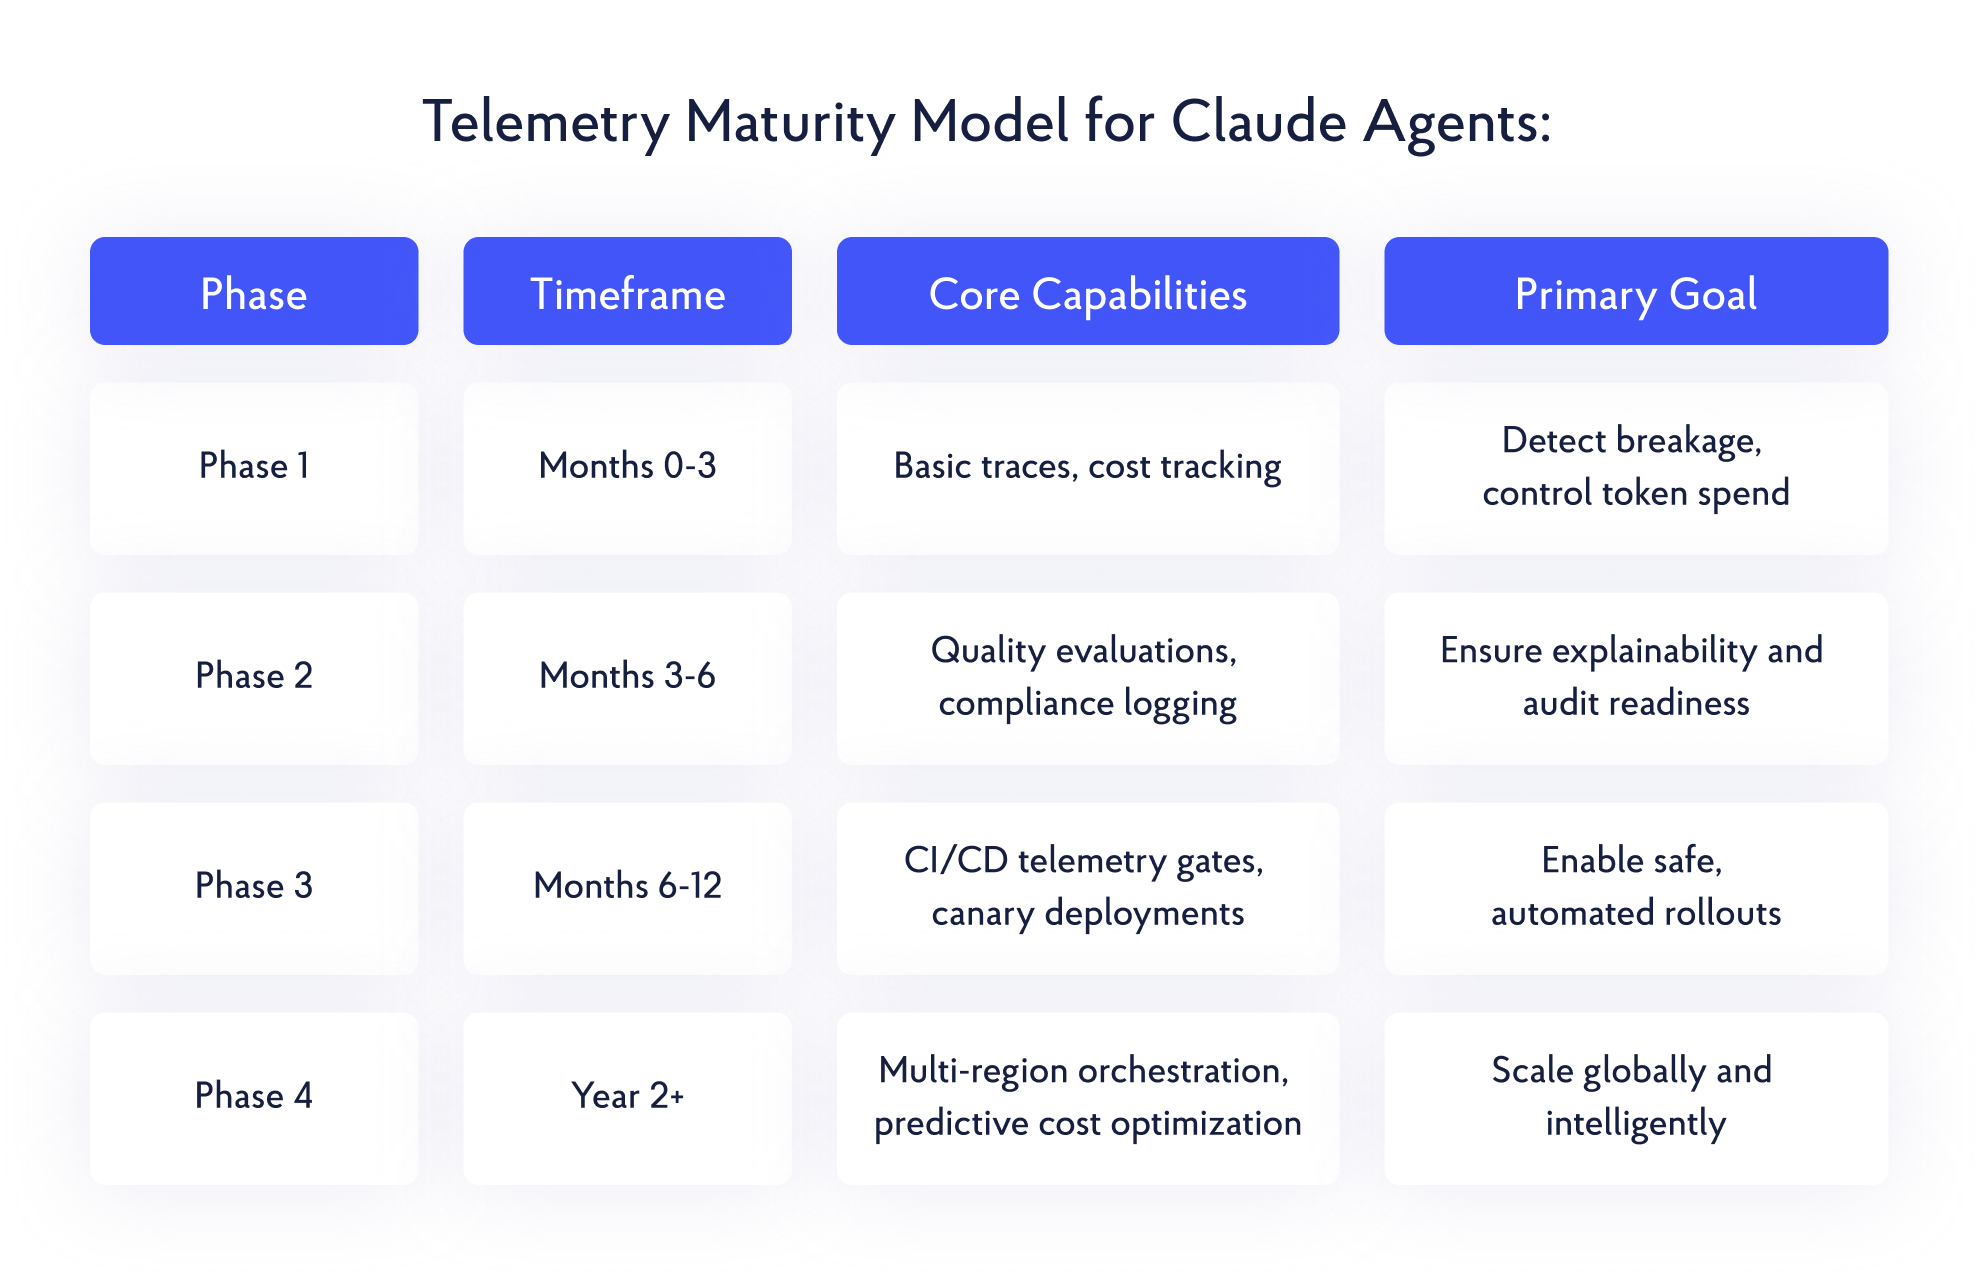
#3 Scaling Telemetry: From MVP to Enterprise
Successful teams evolve telemetry incrementally, aligning instrumentation depth with production maturity.

Anti-Patterns and Pro-Patterns:
- Anti-Pattern: Building global, multi-region telemetry before validating local needs
- Pro-Pattern: Ship adequate telemetry in two weeks, then iterate based on operational evidence
The Future of Autonomous Systems Begins With Robust Telemetry
The journey from Claude prototypes to production-ready agents represents one of the most significant shifts in enterprise software architecture. Agent telemetry is not merely an observability layer component. It is the foundation for the responsible deployment of Claude agents at scale. The patterns we have explored – distributed tracing for cognitive workflows, strategic metrics for business alignment, compliance logging for regulatory adherence, and telemetry-driven CI/CD for continuous improvement – form a complete observability framework.
Enterprises that lead in the age of autonomous systems are not those with the most advanced models, but those with the most mature observability practices. They understand that AI reliability isn’t measured solely by benchmark scores, but by operational metrics, including mean time between failures, cost per accurate decision, and audit trail completeness. They recognize that agent transparency is not a compliance checkbox – it is a competitive advantage that builds trust with customers, regulators, and key stakeholders.
As Claude agents take on increasingly complex responsibilities, the telemetry architecture you design and build becomes the foundation of enterprise intelligence. It ensures that as these systems grow more sophisticated and autonomous, they remain understandable, accountable, and they operate with proven reliability.
Ready to leverage AI agents in your enterprise? Build your autonomous GenAI solutions with Provectus and Anthropic – Start on AWS Marketplace!


.png)