June 6, 2023
12 min read
A Comparison of Large Language Models (LLMs) in Biomedical Domain
Author:
Rinat Akhmetov & Maxim Sokolov, Senior ML Engineers at Provectus
In biomedical and pharmaceutical industries, efficient information retrieval is vital for researchers and engineers. They spend a significant portion of their time searching for and analyzing articles from open data sources and internal publications. To optimize their work and enhance decision-making, it is essential to develop systems that can quickly find relevant information for such tasks as drug discovery, identification of potential side effects, and understanding of action mechanisms for various compounds.
In this article, we compare different large language models (LLMs) designed to tackle this challenge through a Q&A approach.
Experiment Setup
When building a search system for a knowledge base in the biological domain, there are several steps in the processing pipeline. First, we need to identify documents relevant to the query (ML task: Text Embeddings). Next, we process the end user’s query against these documents (ML task: Questions & Answers). Finally, we summarize the information from various documents into a single, comprehensive response (ML Task: Summarization).
In this article, we are investigating the ability of Large Language Models (LLMs) to handle the biological domain and to effectively answer questions based on context within this domain. During these experiments, we paid particular attention to several crucial factors, such as: the relationship between model size and metrics, the correlation between model memory consumption and metrics, and the performance on the latest small cloud GPUs.
Datasets
The dataset is an important component of any machine learning project. For the purpose of this article, we investigated a range of datasets and opted to use BioASQ.
We randomly sampled various portions of the BioASQ dataset. This resulted in 727 unique pairs of context and questions across different types of tasks:
- Factoid: In this task, the system is expected to provide a concise, factual answer to a given question. This typically involves recognizing specific entities or relationships within the text.
- List: This task involves providing a list of items in response to a question. The items can be facts, entities, or any relevant information depending on the context of the question.
- Summary: For this task, the system generates a summarized version of the provided information, maintaining only the most crucial details.
- YesNo: In these tasks, the system is required to answer a question with a simple “yes” or “no” based on the information available in the text.

Here is an example from the BioASQ-trainingDataset6b that demonstrates the type of questions the models had to tackle in our research: “Is Hirschsprung disease a Mendelian or a multifactorial disorder?”
Content
The identification of common variants that contribute to the genesis of human inherited disorders remains a significant challenge. Hirschsprung disease (HSCR) is a multifactorial, non-mendelian disorder in which rare high-penetrance coding sequence mutations in the receptor tyrosine kinase RET contribute to risk in combination with mutations at other genes. We have used family-based association studies to identify a disease interval, and integrated this with comparative and functional genomic analysis to prioritize conserved and functional elements within which mutations can be sought. We now show that a common non-coding RET variant within a conserved enhancer-like sequence in intron 1 is significantly associated with HSCR susceptibility and makes a 20-fold greater contribution to risk than rare alleles do. This mutation reduces in vitro enhancer activity markedly, has low penetrance, has different genetic effects in males and females, and explains several features of the complex inheritance pattern of HSCR. Thus, common low-penetrance variants, identified by association studies, can underlie both common and rare diseases.
Answer
Hirschsprung disease (HSCR) is a multifactorial, non-mendelian disorder in which rare high-penetrance coding sequence mutations in the receptor tyrosine kinase RET contribute to risk in combination with mutations at other genes
Here you can find code for generating the dataset on your own.
Metrics
Several metrics were applied to measure the performance of our AI models for Q&A. The toolkit for that included:
- Exact Match (EM)
- F1 Score
- Semantic Answer Similarity (SAS)
Discover additional information on commonly used benchmarks. It is important to compare and locate the open-source model that best fits your needs by utilizing one of these benchmarks as a reference.
The Semantic Answer Similarity metric has some drawbacks – it can perform poorly in the biological domain due to the difficulties comprehending the technical vocabulary. Additionally, the model used for measuring the similarity is trained on standard vocabulary and lacks in biomedical specialization, which leads to limitations.
Models
For investigating the dependency of model size and metrics and its memory consumption, we evaluated cutting-edge models known as of February 2023. We grouped them into three distinct categories:
- Proprietary models
- Open-source models with <1B parameters number
- Open-source models with >1B parameters number
We created a summary table comparing all researched models. For every model, we provided such details as model size, license, training dataset, and model type, according to the classification above.

Full version is available here.
Prompt Engineering
We used the available data and context as they were, and decided to delay any prompt engineering adjustments for future phases.
However, It can be an interesting read for those who are looking to learn more about the topics discussed in: Large Language Models are Zero-Shot Reasoner and Sparks of Artificial General Intelligence: Early experiments with GPT-4. These articles offer some useful insights.

Hardware
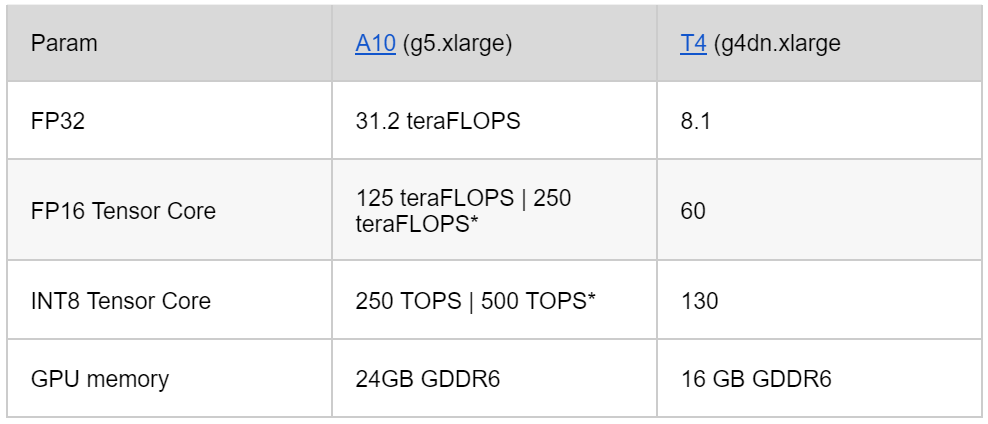
Hardware also plays an indispensable role in machine learning. We tested various Nvidia GPU cards, including the V100, T4, A10, and A10. We demonstrated that A10 cost more than the T4 on AWS, but its capacity to handle larger models, higher batching rates, and improved performance provided more value for money.
Essentially, the choice boils down to whether you want to use a less expensive older card, or invest in a high-performing, newer model. Here are specific details about the Nvidia GPU architectures for those interested in exploring this topic.
The comparison of A10 and T4 GPUs:

Quantization is a significant aspect to consider when choosing a GPU card, too. Quantization can reduce memory consumption and accelerate performance, particularly on INT8, by 8X to 15X. Based on our testing and these factors, we opted to use A10 in our experiments.
Experiment Tracking and Debugging
Every experiment involves a multitude of parameters and configuration settings, which can be difficult to track. Therefore, experiment logging is a mandatory part of any machine learning development process. It provides consistency, facilitates debugging, and enables traceability.
Most experiments with ML models have dozens of implicitnesses. The setup described above solves it and allows to answer a lot of questions, like these:
- What data has been used for a run?
- What is the training time?
- What hardware has been used?
- What is the inference result?
We chose WandB for logging our experiments. It has a simple and user-friendly web interface. It also supports the versioning of models and datasets, and their lineage.
The data was tracked by using built-in WanDB items:
- Datasets -> custom WanDB artifacts
- Inference records -> custom WanDB artifacts
- Server information (CPU, GPU utilization, etc.) -> built-in WanDB collector
- HuggingFace model and other data -> custom WanDB experiment config
On the implementation side, these data dependencies were stored by using WanDB Lineage. The code with configuration is currently stored here. The result is demonstrated below.

Note: You can find it by path ‘Project’ -> ‘Artifacts’ -> Specific dataset -> ‘Lineage’.
Evaluation Results
The chart presents an intricate dependency between model size and F1 score across various model families, setting the stage for a deeper dive into our machine learning experiment outcomes.

Not Only Size Matters
For large language models, it is not universally true that bigger models perform better. The counterintuitive notion of undertraining suggests that smaller models can sometimes achieve higher metrics. This underlines the importance of a number of tokens the model is trained on.

Note: Chart of the relationship between model size and accuracy.
For instance, Facebook demonstrated that a smaller model trained on over a trillion tokens can outperform models ten times its size, like PaLM and GPT3. This implies that the size of the training data can be more impactful than the model’s size. The table below shows that smaller LLaMa models perform better than the previous generation of large models due to the introduction of improved training techniques.

Note: The benchmark comparison of LLaMa models with other LLMs.
Despite their difference in size, Pythia models as an instance of well-trained models are trained enough to yield impressive results in comparison to undertrained OPT models.

Note: F1 metric comparison bar chart for OPT and Pythia models.

Note: Semantic Answer Similarity comparison bar chart for OPT and Pythia models.
Moreover, this huge, billion-weights model can be handled on a “small” A10 by using lessons learned from optimization for diffusion models. As Qualcomm demonstrated in their recent blog post, it is possible to run Stable Diffusion even on mobile devices.
Fine-tuning on Biomedical Data
When it comes to the performance of models trained on biomedical data, it is a common notion that specialized models lead the pack. However, the results can be surprising.

Note: F1 metric comparison bar chart for models trained on biomedical data.

Note: Semantic Answer Similarity comparison bar chart for models trained on biomedical data.
Different model architectures (e.g. ELECTRA and BioBERT) seem to have a slight edge over other architectures, such as T5, RoBERTa, and GPT. This suggests that these can be a go-to architecture for biomedical tasks.
In the meantime, fine-tuning on the BioASQ dataset may not be the silver bullet solution for boosting performance in these tasks. Our experiments did not demonstrate a significant advantage over models only trained on SQuAD2. Bear in mind, however, that these models were fine-tuned in just three epochs only on this dataset.
We also observed that the models that used the ELECTRA architecture and were fine-tuned on the SQuAD2 dataset were leaders in F1 score, Semantic Answer Similarity, and Exact Match. This suggests that this combination is effective for biomedical tasks.
When it comes to biomedical tasks and models trained on biomedical data, the recipe for success is a well-trained ELECTRA model that has been fine-tuned on the SQuAD2 dataset. Note that the fine-tuning on BioASk did not show a significant improvement due to insufficient training and inappropriate prompts.
General Models

Note: F1 metric comparison bar chart for tested models.

Note: Semantic Answer Similarity metric comparison bar chart for tested models.
It is also important to note that models trained on large datasets usually have greater ability to understand the task, and perform better than models trained on only biomedical datasets.
Here are some insights that have led us to this conclusion:
- GPT Models Ace the Test: Both GPT-3.5-turbo and GPT3.5 models lead the pack in F1 score and Semantic Answer Similarity, and they do so with less runtime than many other contenders. This could signal GPT architecture’s knack for the task at hand. However, the GPT-4 model, despite scoring high, comes with a higher runtime. This brings to light a potential performance-efficiency trade-off.
- The Magic of Fine-Tuning: Models with fine-tuning hold their own against new models, even though they are edged out by the GPT models. This underscores that fine-tuning on domain-specific tasks remains a worthwhile strategy.
- Exact Match Scores – Room for Improvement: The Exact Match scores across all models are generally low, with Cohere having the highest score at 0.011. This could hint at the task’s complexity or a need for better optimization to improve exact matching.
- Dolly Models – A Balanced Approach: The Dolly models (databricks/dolly-v2-7b, dolly-v2-3b, and dolly-v2-12b) showcase a balanced performance in terms of F1 score, Semantic Answer Similarity, and runtime. This suggests that these models could strike a good balance for this task.
All in all, there is no one-size-fits-all scenario. Depending on the specifics of the task, a different model or approach can prove the most effective.
Cost of Implementing Large Language Models
The cost of implementing Large Language Models (LLMs), including inference, integration, and establishing a pipeline for batch inference are explored in this section.
Training & Fine-tuning
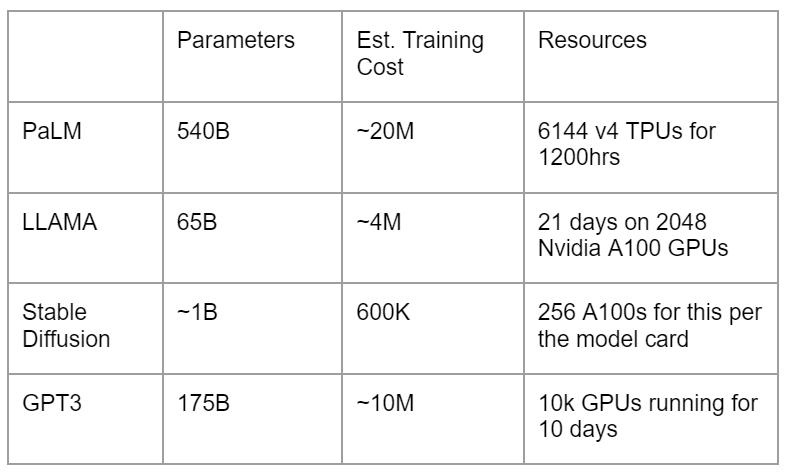
Both training and fine-tuning of machine learning models involve significant investment. The base training phase, which processes 1 trillion tokens, can cost between $1M and $20M. In the meantime, fine-tuning, a phase that shapes the model’s aptitude across varied tasks, can take several days and can cost between $50k and $500k, making it a substantial part of the budget.

The training costs of different models can vary. For instance, training the PaLM model can cost up to about $20M, while LLaMA, although smaller, excels against GPT-3 and costs less. Stable Diffusion can cost about $600K.

Fine-tuning can drastically enhance a model’s performance, making it a critical but costly step.
When it comes to deployment, the inference phase has its own costs tied to the pricing of cloud instances. The entire process of implementing LLMs involves a delicate balance between spend, compute power, and performance. Note that training and fine-tuning are getting less expensive over time.
Inference
Any model can be used immediately by providing you access to both cutting-edge open-source models and private models within your environment, without any concerns about data breaches.
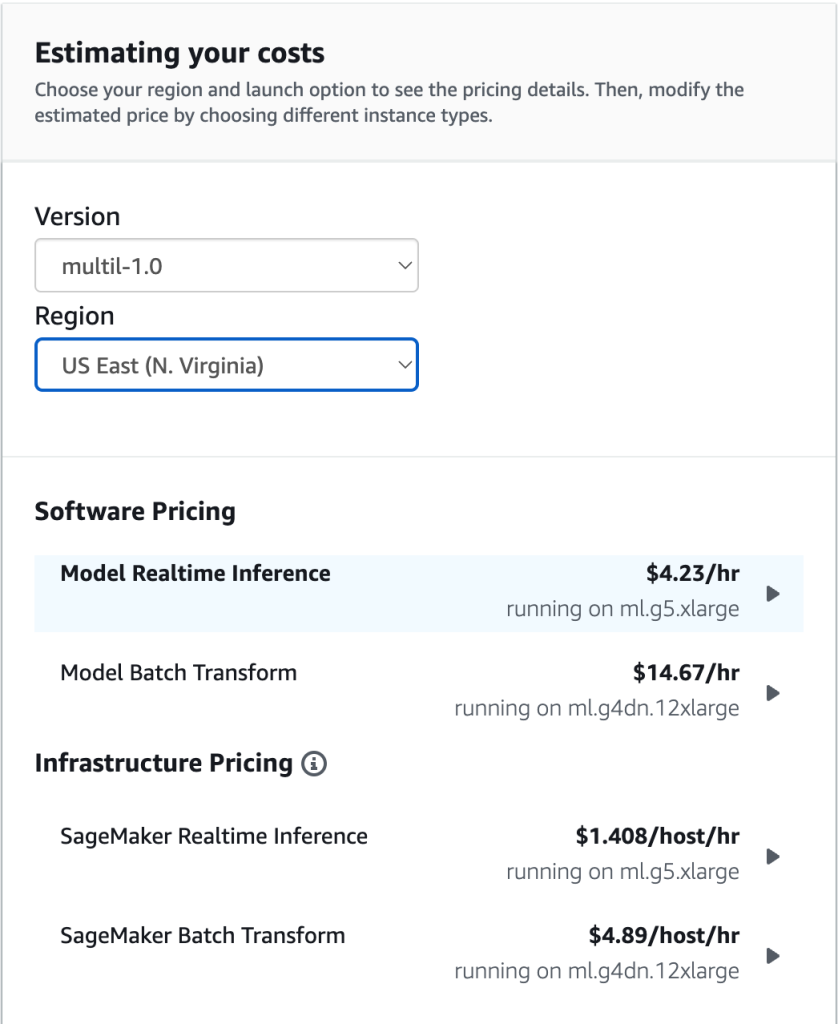
For example, AWS Marketplace offers the opportunity to work with data for just $4.23 per hour, using pre-trained Cohere or Jurassic-2 A21 models. There is always a trade-off to consider between building your own models vs. purchasing them.

Note: Pricing for Cohere on AWS Marketplace.
Conclusion
Integrating a large language model is a journey, with its ups and downs. But with the right tools at hand and a bit of patience, you will be reaping the rewards in no time. Here are several key insights from this article:
- Size is not everything: Smaller, well-trained models like LLaMa can outperform larger models like GPT-3, with training data sizes being more influential than the model size itself.
- ELECTRA and BioBERT demonstrate a slight edge in performance compared to T5, RoBERTa, and GPT for biomedical tasks.
- Fine-tuning on the SQuAD2 dataset appears to be effective for biomedical tasks; the BioASQ dataset does not show significant improvement on a small number of iterations.
- SaaS models like GPT and Cohere lead in F1 score and Semantic Answer Similarity.
- Models with fine-tuning remain competitive, with Dolly models offering a balanced performance in terms of F1 score, Semantic Answer Similarity, and runtime.
- Model performance highly depends on the chosen dataset and optimization methods (e.g. quantization) thanks to such libraries as BitesandBytes. They are constantly improving and can resolve most of these issues for you.
Before we wrap up, we’d like to give a shout-out to Maxim Sokolov and Azamat Khassenov. These guys really knocked it out of the park, working tirelessly on the research and helping us gather all the data we needed.
Happy coding!
If you are looking to learn more about Large Language Models and Generative AI, our team is always available for discussion. Please feel free to reach out to us directly, and our AI/ML experts will be happy to answer your questions and provide guidance on how our solutions can best meet your needs.
